U.S. Gas Production & Consumption Hits Record in 2015
The market for natural gas continues to grow as the U.S. currently produces and consumes more gas than ever before, according to EIA’s 2015 Natural Gas Annual.
Prices for consumers continue to decline, although residential pricing for heating remains highest in the Eastern United States. Net imports also continue to decline as the country starts to export more natural gas and as LNG export facilities begin to come on line.
Production
Domestic dry natural gas production totaled 27.1 Tcf, or 74.1 billion Bcf/d in 2015, a 4.5% increase above 2014.
Pennsylvanian production increased to 13.04 Bcf/d in 2015 over 11.56 Bcf/d in 2014. This is the third consecutive year that the state has recorded the largest total gain in annual production.
Ohio recorded the largest increase, percentage-wise, of any state, for the second consecutive year. Dry natural gas production in Ohio doubled from 1.31 Bcf/d in 2014 to 2.62 Bcf/d in 2015. With the exception of Louisiana and Texas, steady or continuing to increasing production is the norm across the U.S.
Consumption
Total natural gas deliveries to residential, industrial, commercial, and power generation consumers increased 2.8% to 25.1 Tcf, or 68.6 Bcf/d, in 2015.
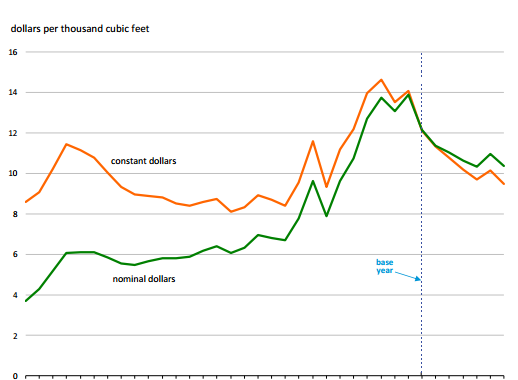
Pricing
Natural gas residential delivery prices have continued the long-term decline from their mid-2000s highs. 2014 featured a slight increase in prices, due to price spikes brought about by extreme winter weather and transportation issues in the Northeast.
States with the highest prices for delivery to residential consumers were primarily located in the capacity-strained Northeast and warmer Southeast. West Coast pricing was also in the upper percentile, due to a lack of regional production and dependence on Canadian imports.
NatGas Imports and Exports
Natural gas imports rose year-to-year for the first time since 2007, increasing 0.8% to 2,718 Bcf. Pipeline imports from Canada’s Western shale basins into the Upper Midwest and Pacific Northwest accounted for a large percentage of the total. LNG from Trinidad/Tobango, Norway, and Yemen to the East and Gulf Coasts provided a small share of the total.
Higher imports were offset by the first year-to-year rise in gas exports since 2012 and net imports continued their steady downward trend.
Exports increased 17.8% from 1,514 to 1,783 Bcf, with 1,054 Bcf going by pipeline to Mexico, roughly 700 Bcf to Eastern Canada, and 28 Bcf by LNG tanker. Texas LNG shipments went to Brazil, Egypt, and Turkey while Alaskan loads were sent evenly to Taiwan and Japan.